
The cooling shade of trees will be crucial to adapting to climate change. But data from New Zealand cities shows tree cover is uneven — and often dictated by wealth. Data journalist Kate Newton reports.

KATE NEWTON
Data Journalist
Picture yourself on a hot day in the shade of a tall building. It offers some respite from the sun but the warmth still rises from the footpath through your shoes and bounces off the surrounding buildings. Out of the shade, the heat is immediate and relentless.
Now picture yourself in the shade again but, this time, beneath the leafy boughs of a mature tree. Which would you pick?
Justin Morgenroth knows what he’d choose. An associate professor of urban forestry at Canterbury University, the thought even inspires a kind of lyricism.

“You’ve got the shake of the wind in the branches, you’ve got dappled light.”
There is also a fundamental difference in the quality of the shade a tree provides, Morgenroth says. Unlike buildings, trees don’t just cast a shadow — they help actively cool the air by releasing moisture through a process called transpiration.
The transpiration cycle


Moisture released by foliage helps to cool the air.
Moisture released by foliage helps to cool the air.
While New Zealand may not experience the same extremes of heat as Australia, the number of hot days (over 25 degrees Celsius) will rise in the coming decades. The latest Intergovernmental Panel for Climate Change report says nature-based solutions, such as increased tree cover, will be critical to our health.
A technical report published by Auckland Council in 2019 describes the risks of the urban heat island effect, where a combination of heat-retaining construction materials — think lots of concrete — and a lack of green space sends the temperature soaring. “Urban centres can experience temperatures up to four or five degrees higher than surrounding non-urban areas,” the report’s authors wrote.
“The cooling that neighbourhoods get from trees is critical to reducing that …effect,” Morgenroth says. But not everyone has a big, mature tree in their garden or outside their house, or even close access to a shared space like a park or walking track. Increasing housing densification — desperately needed in our big cities — can mean decreasing tree cover.
Auckland was the first of our city councils to start actively collecting information about the level of tree canopy cover within its neighbourhoods. Since 2018, Morgenroth has been helping Wellington and Christchurch city councils to map their tree canopy cover too, with several other councils interested in doing the same.
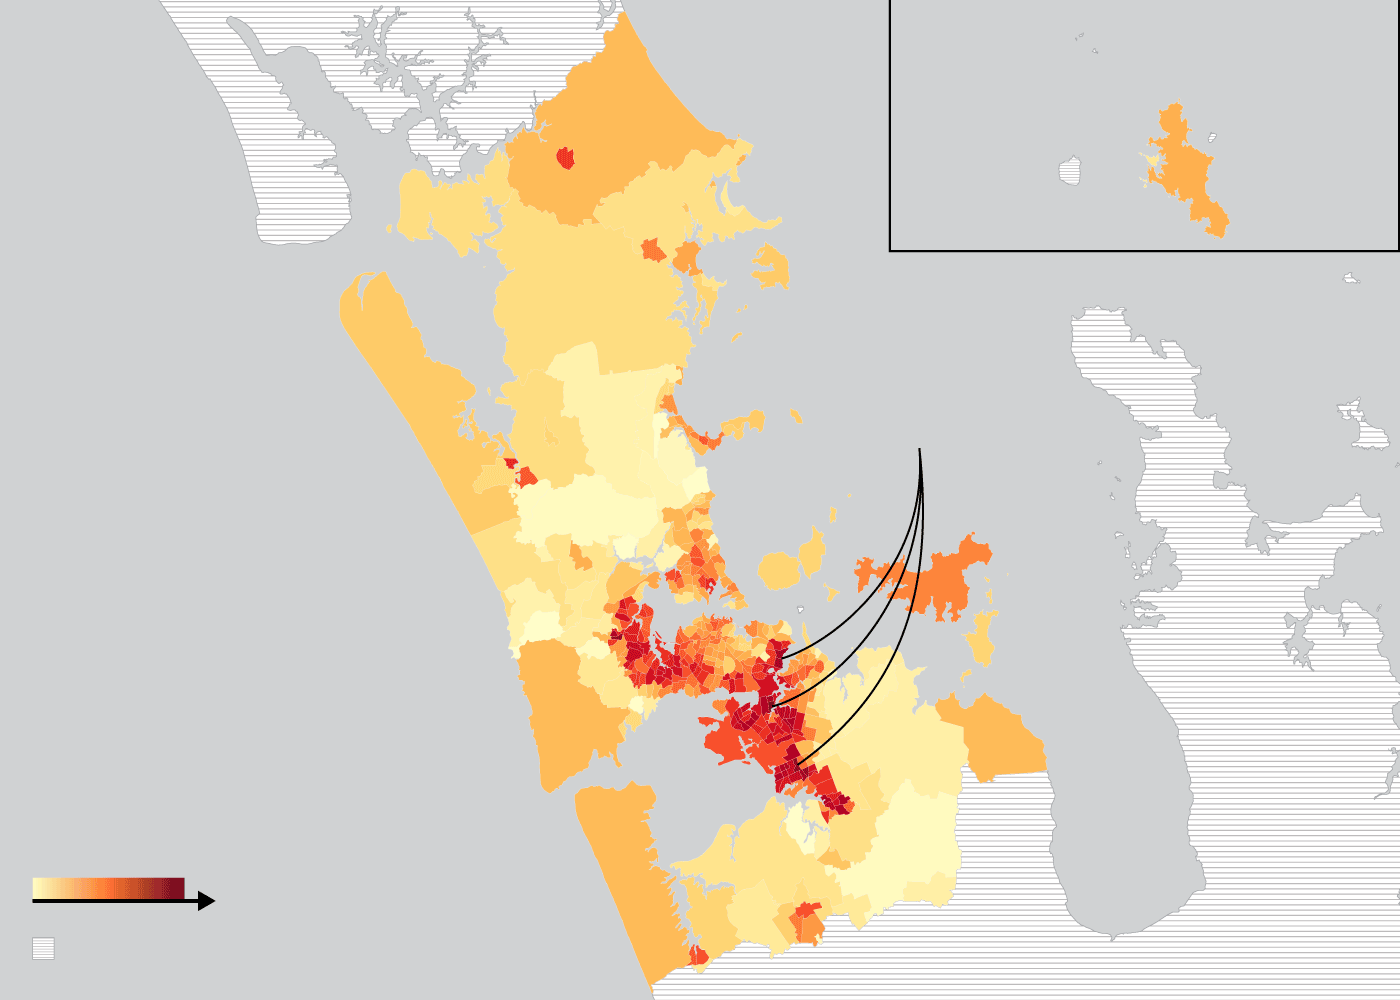
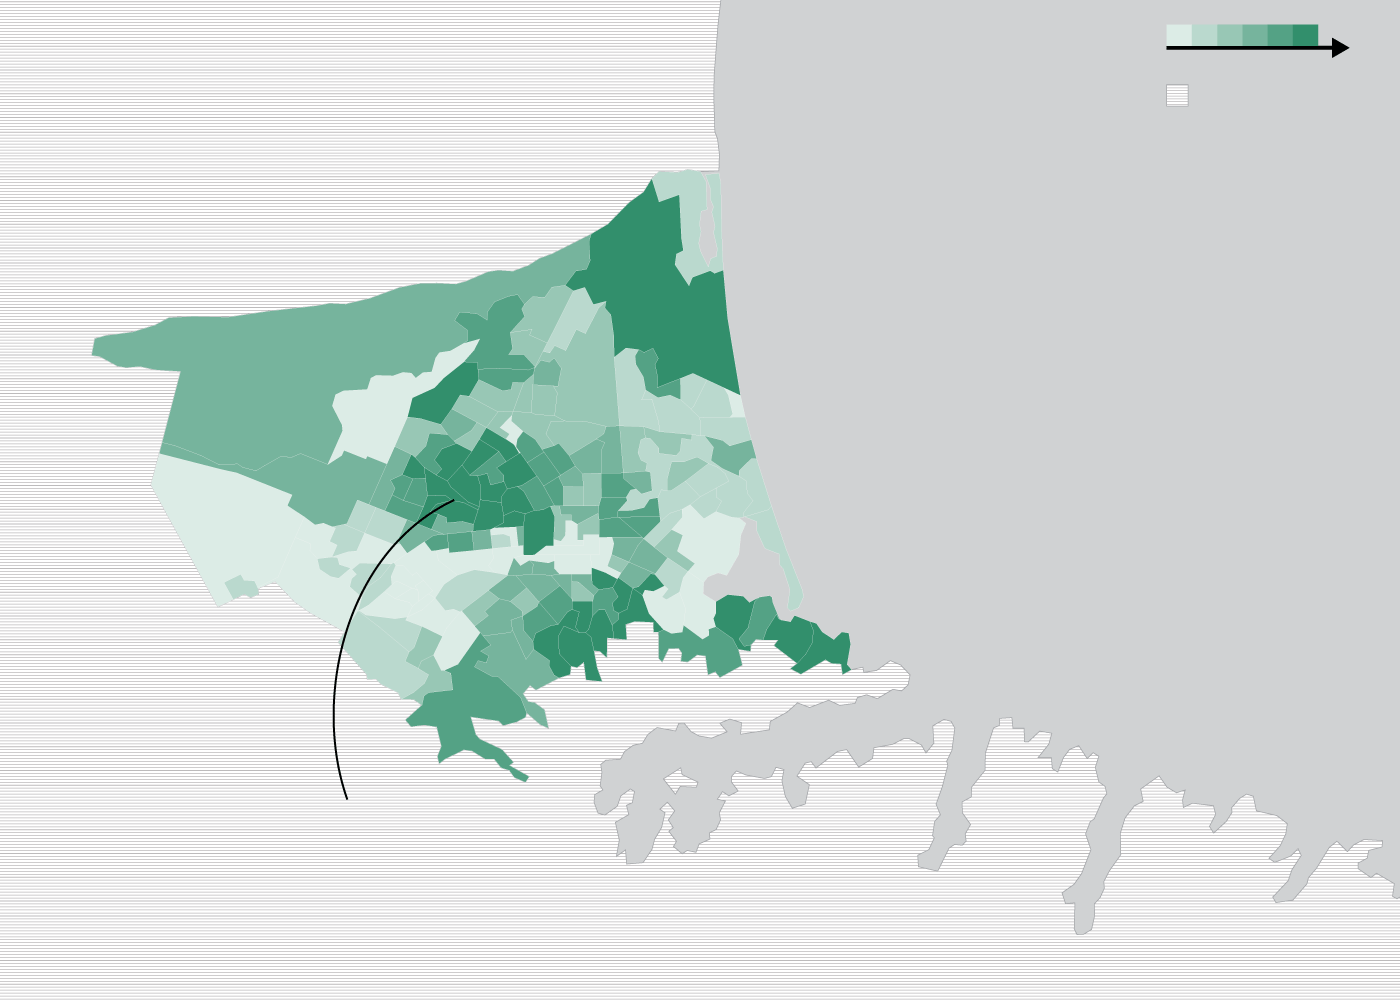
What data from all three councils shows is that tree canopy cover is hugely uneven. There are areas in Auckland with less than 2 per cent tree cover, while other neighbourhoods within forested areas, such as the Waitakere Ranges, have up to 82 per cent cover.
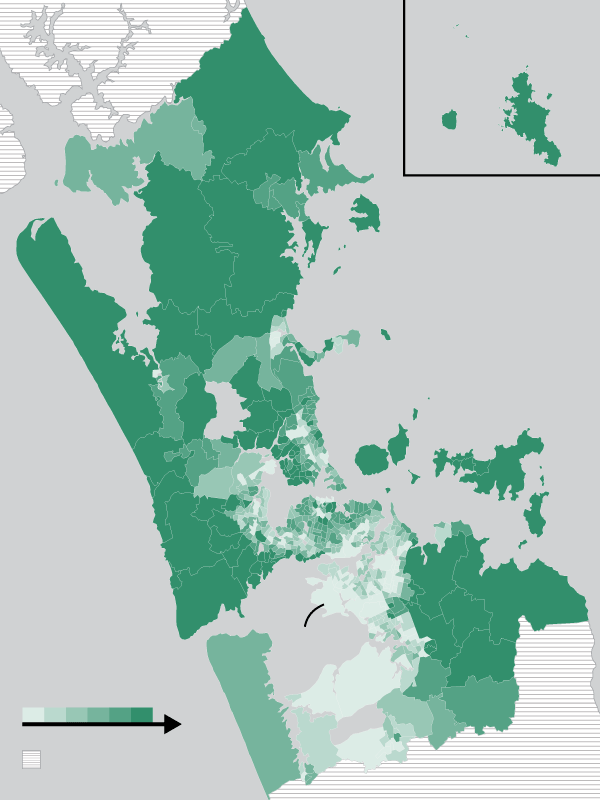
Barrier islands
Waitakere
Ranges
South
Auckland
TREE COVER
Data NA or area
not studied

Barrier islands
Waitakere
Ranges
South
Auckland
TREE COVER
Data missing or
area not studied
Barrier islands
Waitakere
Ranges
South
Auckland
TREE COVER
Data missing or
area not studied
Socio-economic status already plays a huge role in our ability to cool ourselves when it’s stinking hot outside. Can you afford an air-conditioning unit or a fan — and more importantly, the power to run it? Do you live near a park, a beach, or a pool? If you don’t, do you have the means to get to one?
At a more fundamental level, wealth often corresponds to whether you live in a cool neighbourhood or a hot one. Shade and prosperity are linked together in the phrase ‘leafy suburbs,’ used as a byword for New Zealand’s well-heeled, established neighbourhoods.
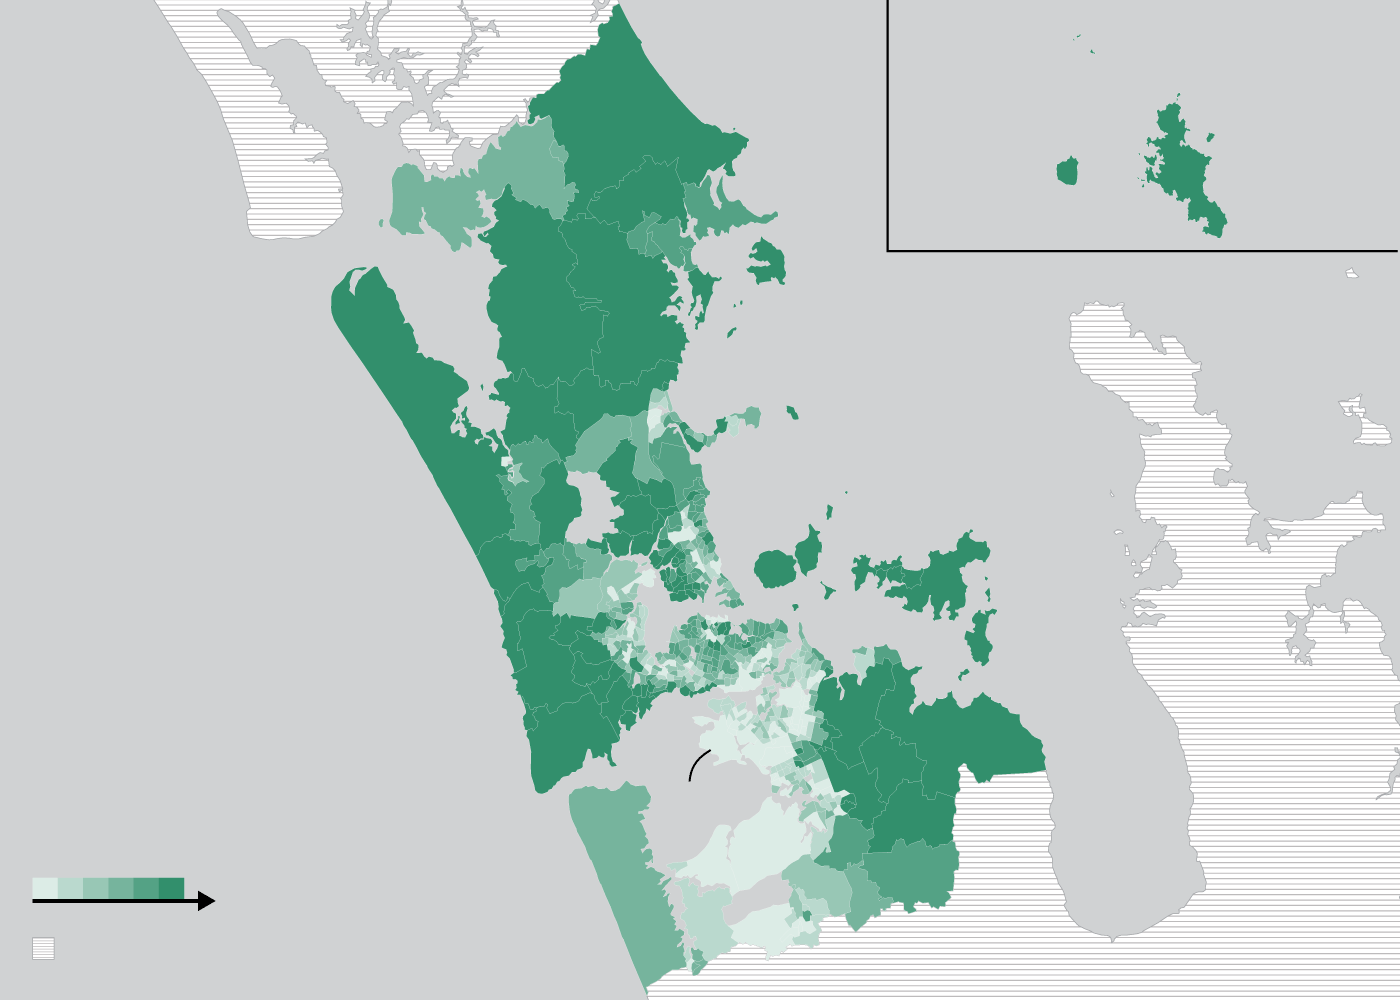
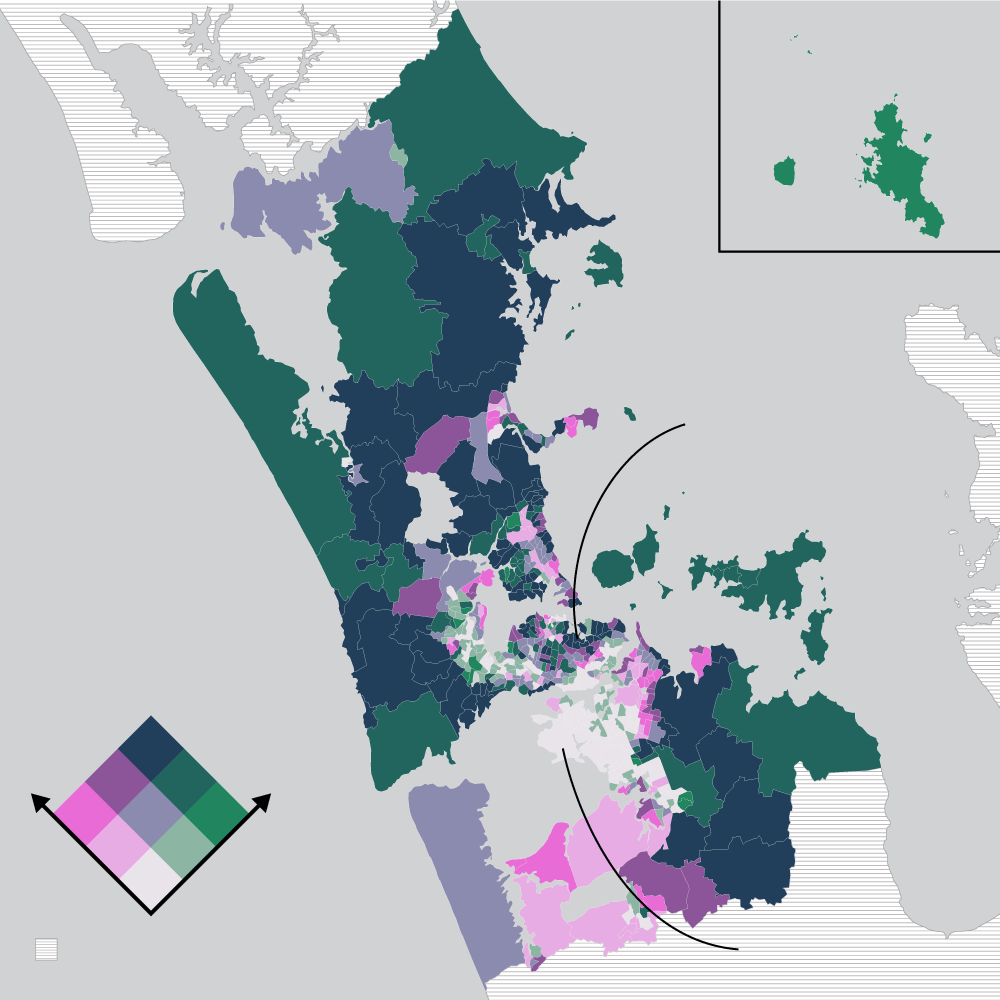
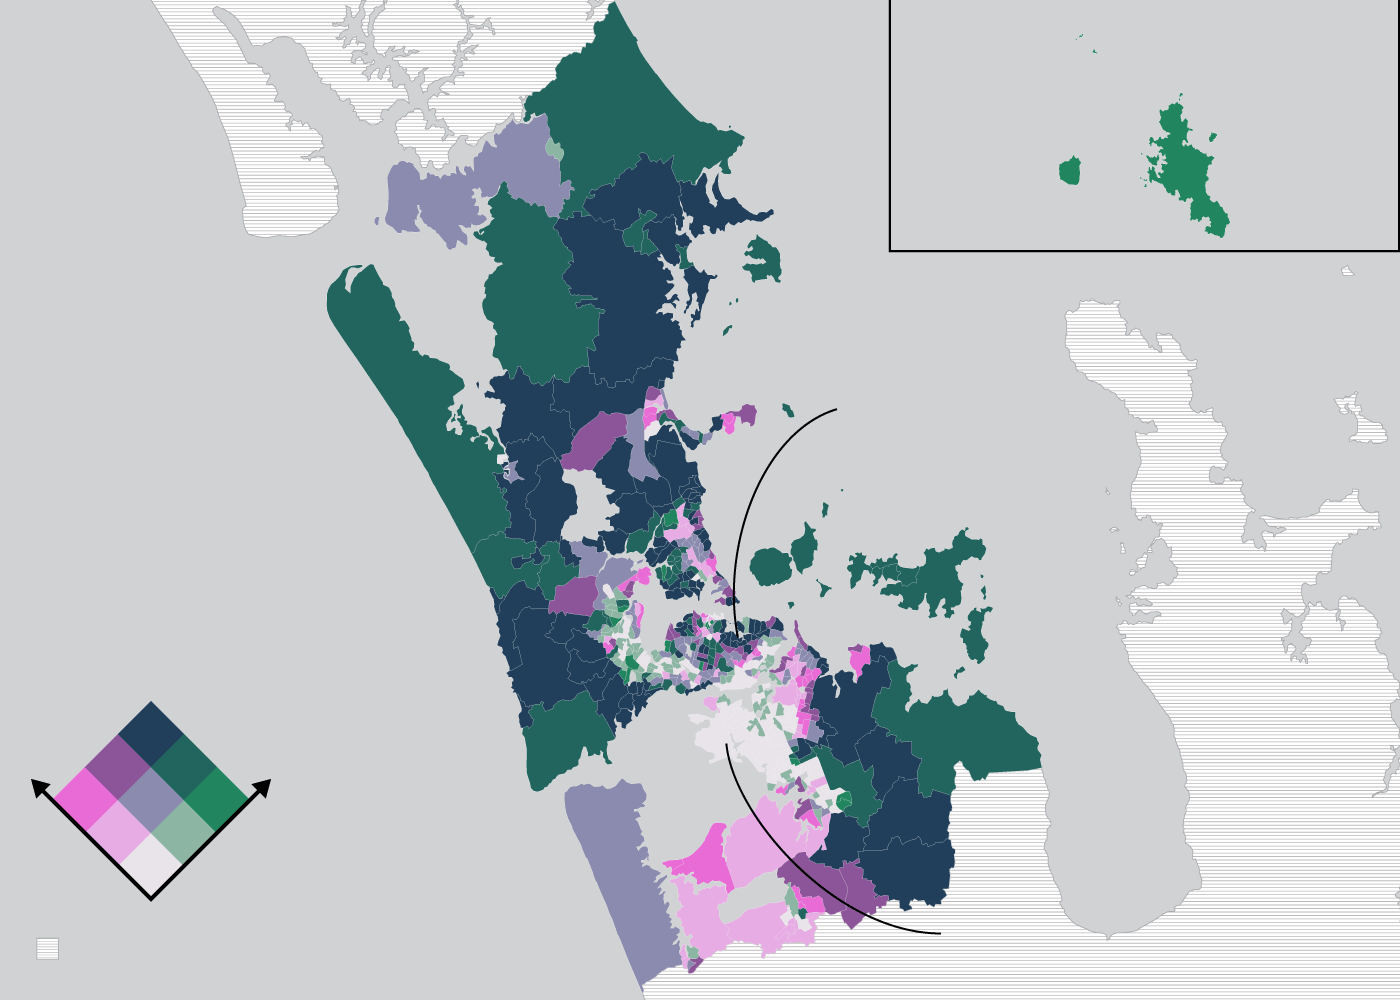
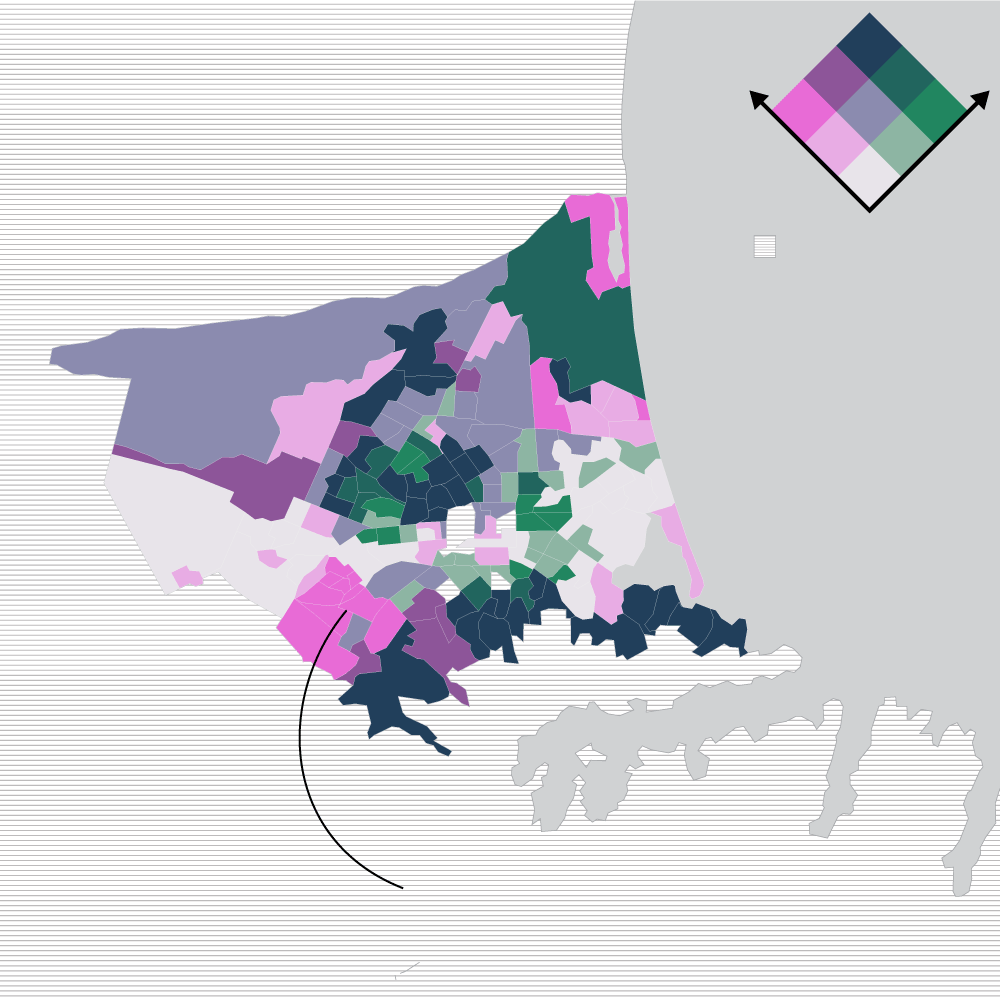
When Stuff combined the council tree canopy maps with socio-economic data, it bore out the link between wealth and leafiness. The next map simultaneously shows the level of tree canopy cover in each neighbourhood in Auckland and how wealthy the area is: the darkest areas on the maps are the leafiest, most prosperous neighbourhoods. The lightest areas are those with little canopy cover and the lowest level of wealth.

Barrier islands
Remuera and St
Heliers are among
a cluster of wealthier,
leafy suburbs
PROSPERITY
TREE COVER
This part of Auckland
has low tree cover and
higher deprivation
Data NA or area
not studied
Barrier islands
Remuera and St
Heliers are among
a cluster of wealthier,
leafy suburbs
PROSPERITY
TREE COVER
This part of Auckland
has low tree cover
and higher deprivation
Data missing or
area not studied
Barrier islands
Remuera and St
Heliers are among
a cluster of wealthier,
leafy suburbs
PROSPERITY
TREE COVER
This part of Auckland
has low tree cover
and higher deprivation
Data missing or
area not studied
There is a concentration of both prosperity and tree cover in places like Remuera, Parnell, Herne Bay and the inner eastern bays: Kohimarama, St Heliers and Mission Bay. The barer, least wealthy areas are concentrated in the city’s inner west, parts of East Auckland like Glen Innes and Point England, and much of South Auckland.
Last year, Cecil Konijnendijk van den Bosch, a professor at the University of British Columbia proposed a guiding standard for green space that he named the 3-30-300 rule. The standard is simple, Justin Morgenroth says: “Every person should be able to see three trees from their home. They should have 30 per cent canopy cover [in their neighbourhood] and they should be within 300 metres of some meaningful green space.”
While tree canopy cover in Auckland varies within all deciles, very few of the poorer areas have more than 30 per cent cover.


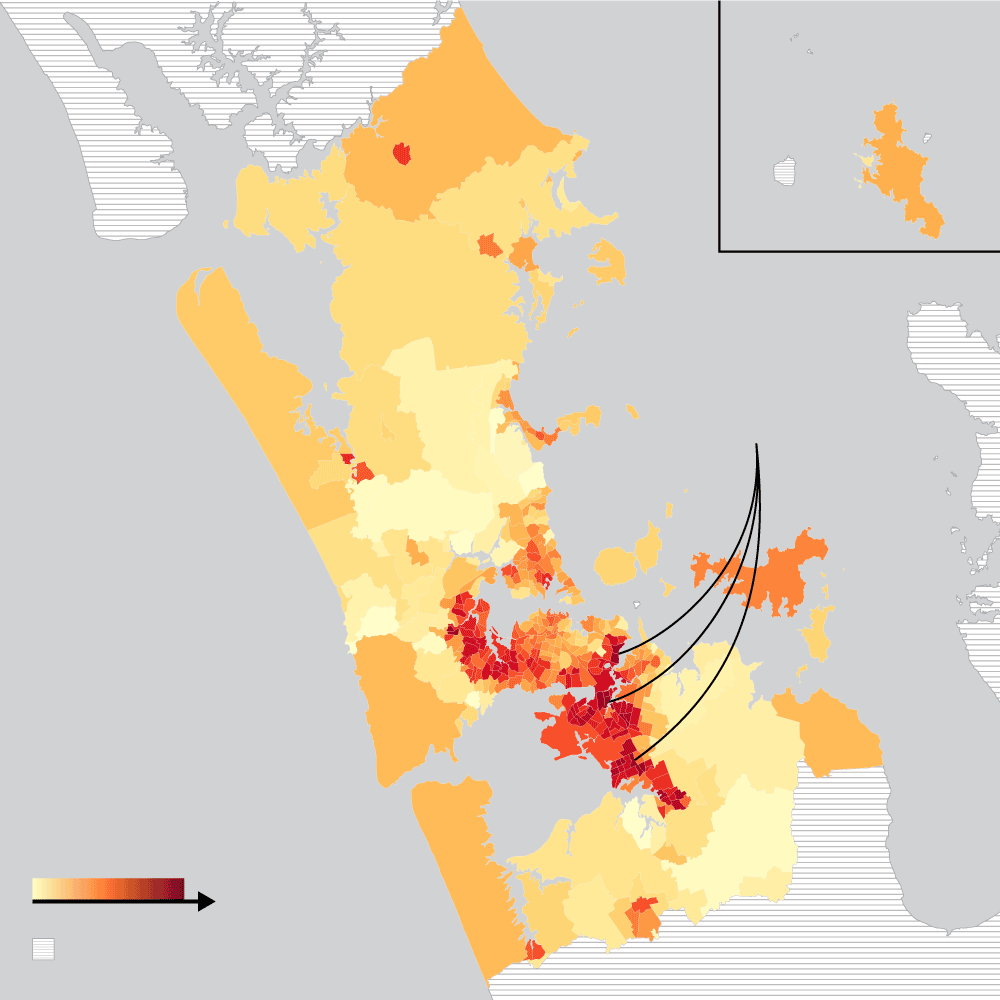
The council has plans for planting programmes in south Auckland recreational areas. Its 2019 report went further than looking at socio-economics — it added in demographic data such as rates of chronic illness to develop a ‘heat vulnerability index’. The areas with the highest index ratings are once again in south and east Auckland, and the more urban parts of west Auckland, away from the cooling benefits of the Waitākare Ranges.
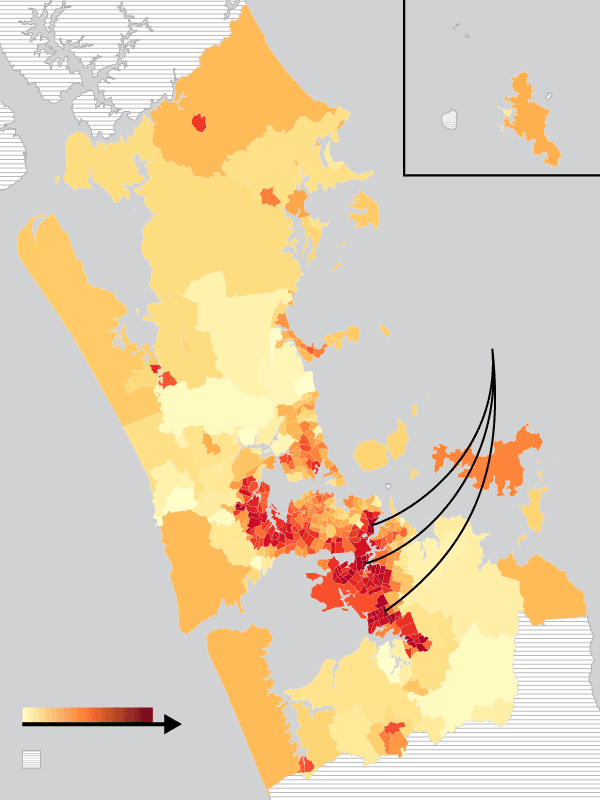
Barrier islands
A combination of low
tree cover, higher
deprivation and
chronic illness makes
these deep red
areas most vulnerable
to increasing heat
VULNERABILITY
Data NA or area
not studied
Barrier islands
A combination of low
tree cover, higher
deprivation and chronic
illness makes these deep
red areas most vulnerable
to increasing heat
VULNERABILITY
Data missing or
area not studied
Barrier islands
A combination of low
tree cover, higher
deprivation and chronic
illness makes these deep
red areas most vulnerable
to increasing heat
VULNERABILITY
Data missing or
area not studied
Justin Morgenroth’s research used a slightly different method to the Auckland Council mapping but shows a similar disparity in Wellington and Christchurch. “All of our cities have this issue,” he says. “There’s a huge amount of research that shows the link between tree cover and socioeconomics — what the reasons are for that are less well-known.”
Overall, the area in the Wellington study (which did not include Porirua or the Hutt Valley) showed tree canopy cover of just over 30 percent. Within that, though, coverage ranged from less than 10 per cent in parts of south Wellington and the downtown area, to almost 50 percent in northern suburbs bordering the town belt.
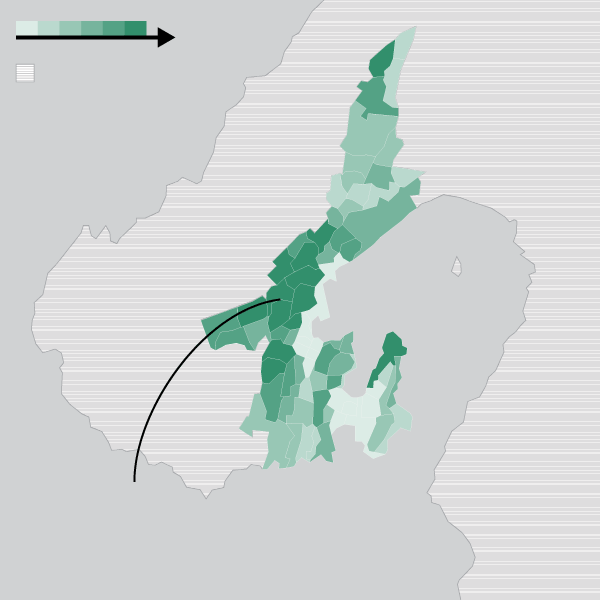
TREE COVER
Data NA or area
not studied
Suburbs like Thorndon,
Wadestown and Karori
benefit from being beside
Wellington’s town belt

TREE COVER
Data missing or
area not studied
Suburbs like Thorndon,
Wadestown and Karori
benefit from being beside
Wellington’s town belt

TREE COVER
Data missing or
area not studied
Suburbs like Thorndon,
Wadestown and Karori
benefit from being beside
Wellington’s town belt
Once again, there’s a pattern that emerges when this data is overlaid with socio-economic data. The areas with little tree cover and lower levels of prosperity are concentrated in the flat, southern suburbs near the airport, which also happen to be prone to sea-level rise and extreme weather events.
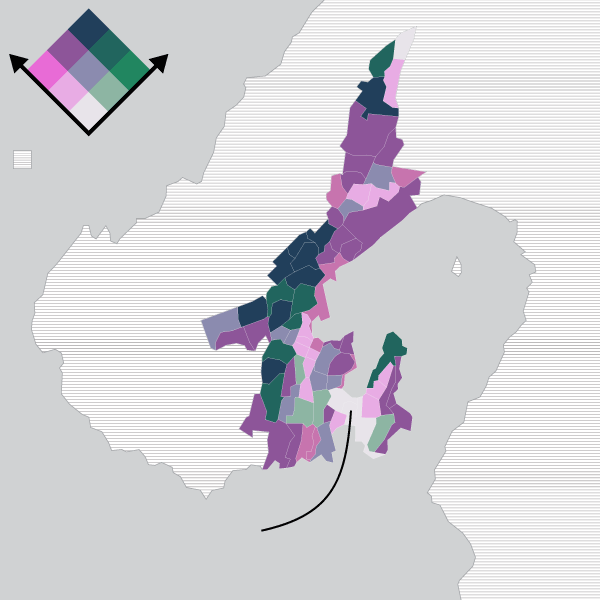
PROSPERITY
TREE COVER
Data NA or area
not studied
Flat suburbs close
to the airport lack
tree cover and are
less well-off

PROSPERITY
TREE COVER
Data missing or
area not studied
Flat suburbs close to the
airport lack tree cover and
are less well-off

PROSPERITY
TREE COVER
Data missing or
area not studied
Flat suburbs close to the
airport lack tree cover and
are less well-off
Morgenroth says the appropriate level of tree cover will differ based on the city’s natural environment “Wellington is carved out of a forest, whereas Christchurch is carved out of grassy flats.”
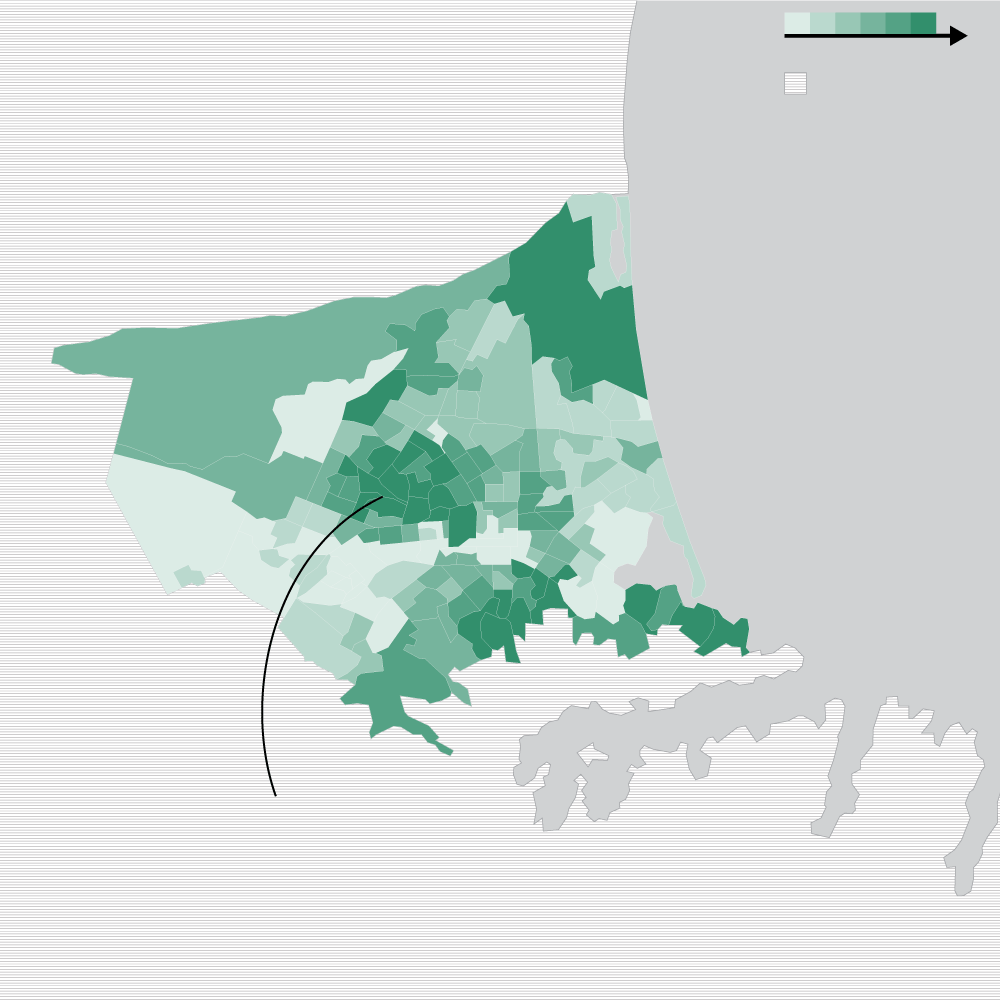
The overall coverage in the area Morgenroth mapped for Christchurch City Council is 13.6 percent — lower than both Auckland (18 per cent) and Wellington.

TREE COVER
Data NA or area
not studied
The suburbs just west
of Christchurch’s centre
are among the city’s
oldest and leafiest
TREE COVER
Data missing or
area not studied
The suburbs just west
of Christchurch’s centre
are among the city’s
oldest and leafiest
TREE COVER
Data missing or
area not studied
The suburbs just west
of Christchurch’s centre
are among the city’s
oldest and leafiest
Overlaid with socio-economic data, the traditional ‘leafy suburbs’ stand out: Fendalton, Cashmere, Strowan among them. Some of the areas with the least tree coverage are in less prosperous neighbourhoods to the east of the city that were also badly affected by the Canterbury earthquakes.
But Morgenroth says the variance in Christchurch is a good example of how tree coverage needs to be factored into urban planning. “In Christchurch there’s some relatively new suburbs that are reasonably affluent but they’re new [and so] tree cover there was in the bottom decile. It’s a question of time.” This area, south-west of the city, is bright pink on the map.

PROSPERITY
TREE COVER
Data NA or area
not studied
New housing in suburbs
like Halswell and Aidanfield
lacks much tree cover
PROSPERITY
TREE COVER
Data missing or
area not studied
New housing in suburbs
like Halswell and Aidanfield
lacks much tree cover

PROSPERITY
TREE COVER
Data missing or
area not studied
New housing in suburbs
like Halswell and Aidanfield
lacks much tree cover
Likewise, the ‘character’ suburbs that are dominated by the affluent are leafy because of their long heritage, he says. Fendalton is one of Christchurch’s oldest suburbs — and so the urban forest there is well-established.
And while some neighbourhoods have high canopy coverage, accessibility also matters, Morgenroth says. If all the trees are on a steep, inaccessible hillside, there will still be some transpiration benefits but “it’s not going to provide shade to anyone.”
Other councils are now showing interest in mapping their canopy. Morgenroth would like to see far more nuanced descriptions of New Zealand’s urban forests. “Canopy cover is measured because it’s really easy to measure but … all it gives you is a two-dimensional description.” Viewed from above, a tree two metres in diameter could be a two- to three-metre high flowering cherry tree or it could be a 40-metre poplar. “One of them has a hell of a lot more leaf area,” Morgenroth says. “Any of that stuff around shading or transpirational cooling is related to leaf area — and canopy cover does not give you that.”
What tree canopy mapping can do, though, is show where trees are and aren’t — and how that is changing. “If [councils] know that there are neighbourhoods that only have four per cent canopy cover, they would hopefully see it as their responsibility to increase canopy cover in that area.”


Data sources: RIMU/Auckland Council (Auckland tree canopy and heat vulnerability data), Justin Morgenroth (Wellington and Christchurch tree canopy data), EHINZ (deprivation data).
Together, we can keep it that way.
Like you, we want a better future for all New Zealanders. We want to know how the Government plans to get to zero carbon, and how the Climate Change Commission's advice will be activated. Our specialist climate desk is committed to covering this global crisis with a unique mix of rigour, reality and resolve.
We're asking for your support to ensure this essential work remains accessible to everyone.
If you're concerned about the climate, please become a Stuff supporter today. Your contribution will help power our climate change reporting, and support our mission to make Aotearoa a better place, together.


